145 Million Americans Live in States With Transparent Local Government Finances
A fifty-state review of how local government financial data is collected, structured, and published
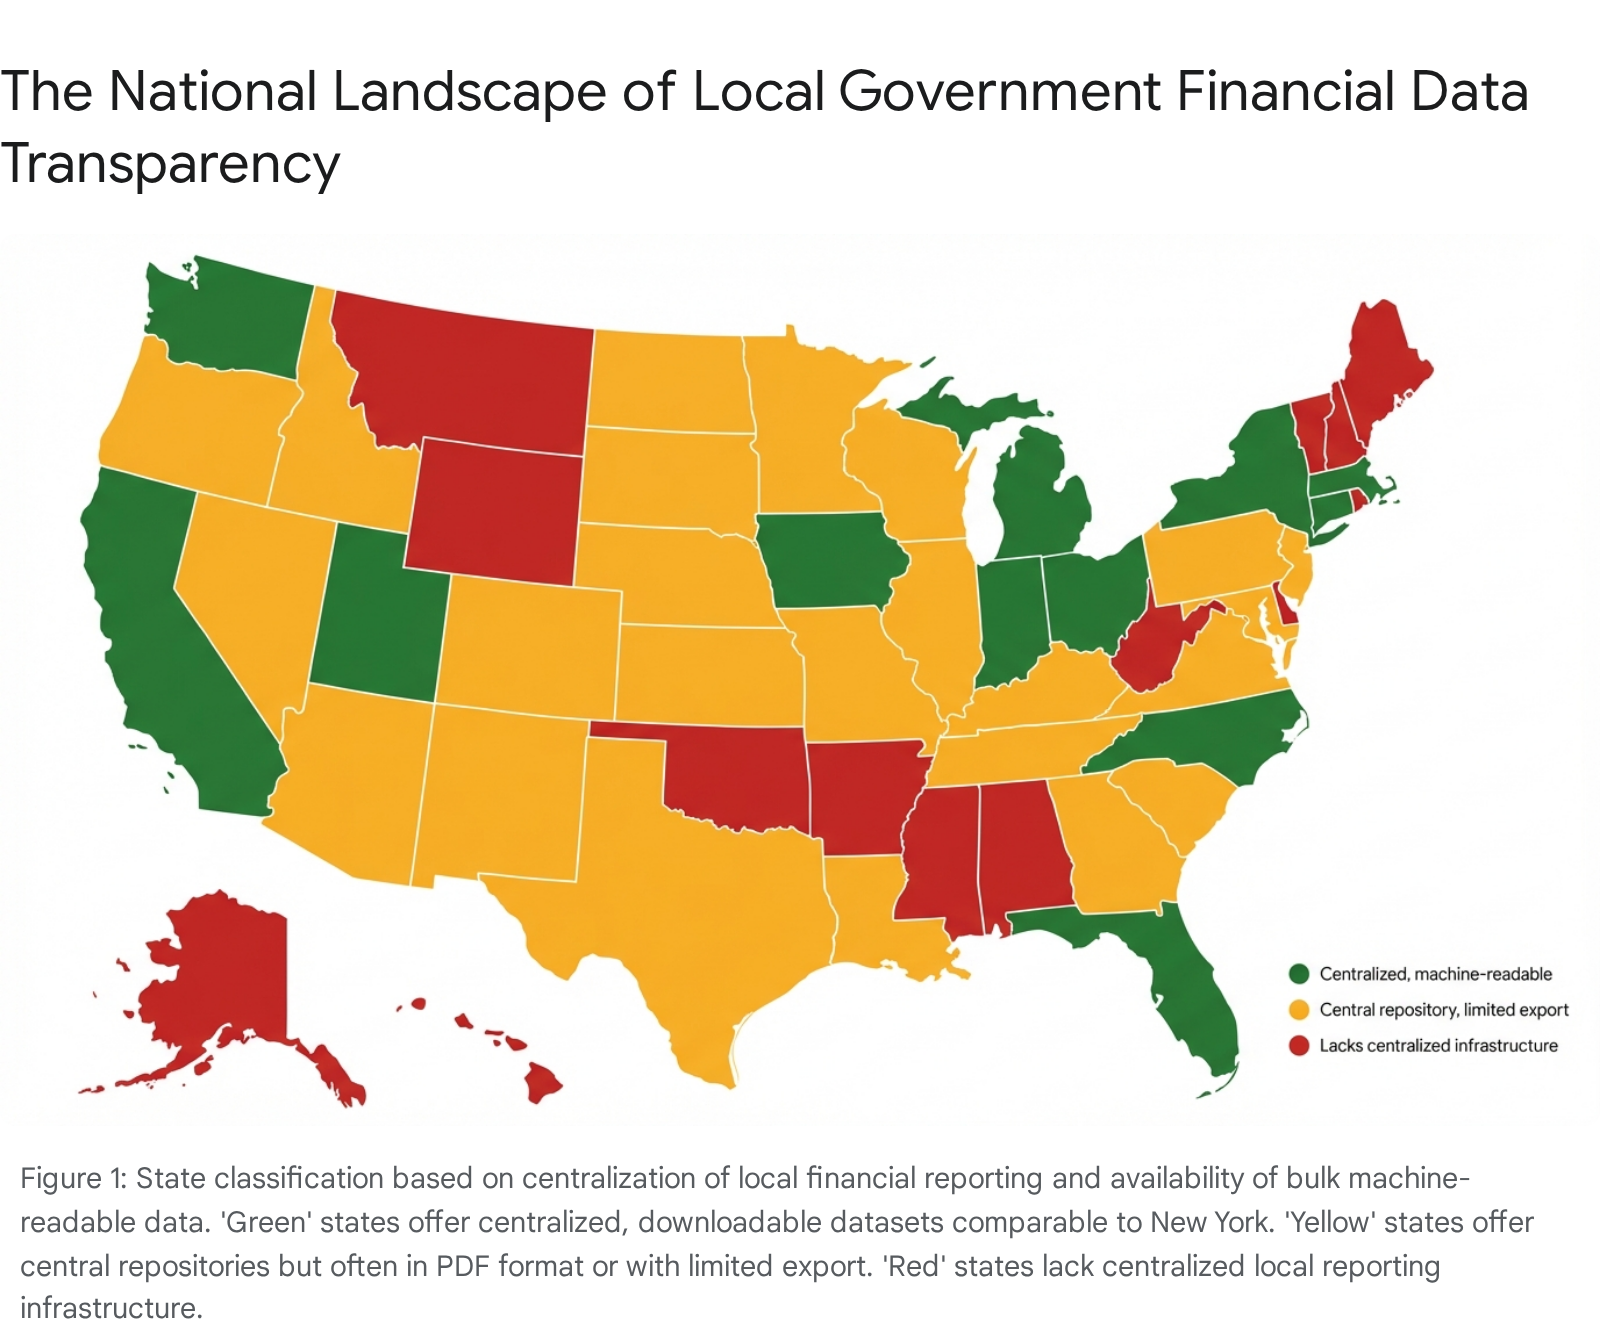
Note: Rankings based on automated review of state-level reporting requirements and machine-readable data availability.
I started this project in New York because I live here. Later, I wanted to know: how many other states have the same kind of data?
When I started seven weeks ago, my plan was to manually download PDF audit reports from every city, county, town, village, district, and authority in the state, then either hand-enter the financial data myself or secure funding to have credible freelancers help me. I spent the first several weeks doing exactly that — pulling ACFRs for cities like Yonkers and New Rochelle and seeding my database by hand.
Then I got lucky. I discovered that New York’s Office of the State Comptroller had already collected all of this data and made it available for bulk download in machine-readable form. Weeks of planned manual labor replaced by a few import scripts. That lucky break raised an obvious follow-up question: which other states have done the same thing?
The Fifty-State Review
I conducted a review of all fifty states to understand how each one collects, standardizes, and publishes local government financial information. I used Google Gemini’s Deep Research to systematically review state comptroller sites, statutory reporting requirements, and public data portals. The tooling dramatically accelerated discovery, but the classifications, interpretations, and conclusions are my own.
What I found is a sharp structural divide in how different states consider, collect and make available local government financial data.
The Real Transparency Divide
The key distinction is not whether data is “public” — virtually all government financial data is technically public. The question is whether it’s structured.
In states like New York, Washington, Ohio, Indiana, and the other green states on the map above, local governments submit standardized financial data into centralized systems. These platforms enforce uniform charts of accounts, validation rules, and consistent definitions. Spending, debt, and fiscal health can be compared across jurisdictions with minimal manual work.
Unfortunately, in much of the country, financial disclosure still means posting standalone audit PDFs. Try comparing per-capita police spending across 200 municipalities when each one publishes a different 300-page PDF with its own chart of accounts. It’s functionally opaque.
And then there are the states that have no centralized local reporting infrastructure at all.
The green states have centralized, machine-readable systems. Yellow states have central repositories but the data is often PDF-only or limited in export options. Red states lack centralized local reporting infrastructure entirely.
145 Million Americans Can See How Their Tax Dollars Are Spent
The good news is that those twelve green states are home to over 145 million people — nearly 44% of the country according to the 2020 Census. That’s how many Americans currently live in states where structured local government financial data exists and bulk comparative analysis is possible. The other 56% are largely in the dark.
Those local governments collectively spent approximately $1.18 trillion in FY 2022, according to the U.S. Census Bureau’s Annual Survey of State and Local Government Finances — a massive share of public spending that, in these twelve states, can actually be tracked and compared.
The Best State Databases
see below for more links and details about the best state local government financial dtabases. I’ve ordered them roughly by how useful they are for the kind of bulk comparative analysis I’m doing:
| State | Database | Notes |
|---|---|---|
| Florida | LOGERx | First-in-the-nation XBRL mandate; the gold standard |
| New York | Open Book NY / FSMS | Uniform chart of accounts; bulk CSV for all local governments |
| Utah | Transparent Utah | ~1,000 entities; 250M+ records; all local governments required to submit since 2017 |
| Washington | Financial Intelligence Tool | ~2,000 governments; decade of data; peer comparison and fiscal health indicators |
| Ohio | Ohio Checkbook | Transaction-level detail down to individual checks; voluntary for local governments |
| Indiana | Gateway | All local units; downloadable data; extensive report builder |
| Michigan | Community Financial Dashboard | 12+ fiscal health indicators; 16 years of data; developing its own XBRL taxonomy |
| California | ByTheNumbers | State Controller; 13M+ fields; cities, counties, special districts; data back to 2002 |
| North Carolina | LGC Data & Reports | Legislatively mandated since 2015; counties and municipalities; benchmarking tool |
| Connecticut | Municipal Fiscal Indicators | All 169 municipalities; structured budget data on data.ct.gov |
| Massachusetts | Municipal Databank | 65+ data elements; community comparison tool with Excel export; no bulk download |
| Iowa | data.iowa.gov / City Budget Explorer | Mandatory (Iowa Code Ch. 24); ~1,800 entities; CSV, JSON, and API via Socrata |
Florida: The Gold Standard
Florida deserves special mention. In 2018, the state passed HB 1073 mandating that all local governments file their financial reports in XBRL — the same structured data standard the SEC requires for corporate filings. The LOGERx system went live in 2022 and remains the first and only state-level XBRL mandate for local government financials in the country. Most other green states, including New York, publish bulk CSV or offer interactive dashboards, which is excellent for analysis but doesn’t carry the semantic richness of XBRL. If other states follow Florida’s lead, a truly comprehensive national database of local government finances becomes possible.
California: A Cautionary Tale
California illustrates both the promise and the fragility of transparency infrastructure. The state’s raw data is solid — the State Controller’s ByTheNumbers portal publishes 13 million+ fields of structured financial data for cities, counties, and special districts going back to 2002. Up until very recently they had a NYBenchmark-like analytical layer that made that highlighted at risk governments and made the data more accessible to non-experts. The State Auditor’s High-Risk Local Government Dashboard ranked all 471 California cities on fiscal health using ten financial indicators — exactly the kind of tool that lets residents and journalists ask hard questions about how their local government is managing money. Then in October 2023, following a change in leadership at the auditor’s office, the dashboard was quietly discontinued and scrubbed from the website. No announcement, no archive, no explanation.
This shouldn’t surprise anyone. Structured financial data invites scrutiny, and scrutiny creates pressure. There will always be elected officials and government employees who resent having their spending decisions compared to their neighbors’. That resentment is a feature, not a bug — it means the data is doing its job. But it also means transparency infrastructure is perpetually at risk of being defunded, deprioritized, or quietly shut down by the very people it’s designed to hold accountable.
The problem is compounded by the collapse of local news across the country and around the world. When California killed its dashboard, there was barely anyone left to notice. The California Policy Center, a good-government nonprofit, has since built a replacement — but civic projects come and go, and the underlying data should never depend on one organization’s funding or interest. The episode illustrates why transparency infrastructure needs to be grounded in statutory mandate — like Florida’s XBRL requirement — rather than left to the discretion of whoever happens to hold office. Dashboards built on political goodwill can disappear the moment that goodwill changes.
The variation across these systems is significant — in format, granularity, whether participation is mandatory, and how easy they make bulk access.
Where This Goes Next
There’s no reason this project should stay limited to New York. Every green state on the map above has the data infrastructure to support the same kind of cross-jurisdictional benchmarking I’m doing now. Washington, Ohio, Indiana, Michigan — these states are ready for the same treatment, and expanding to cover them is a medium-term goal.
For the yellow and red states, I hope this analysis is useful in a different way. The gap between “we publish audit PDFs” and “we have a centralized, structured reporting system” is the gap between nominal transparency and functional transparency. States that close that gap don’t just help researchers and civic tech projects — they give their own residents, journalists, and policymakers the ability to ask basic comparative questions about how their tax dollars are being spent. Every state should aspire to be green on this map.
The absence of structured data is the main reason civic technology projects so often stall outside a handful of states. Identifying where high-quality data already exists is the first step toward scalable, cross-jurisdictional accountability.
Live New York benchmarking work based on this analysis is available at benchmarkusa.org.